Data and Analytics Management · Topic 2 of 2
Reports and Dashboards
Salesforce analytics: report types, report formats, bucket fields and formulas, joined reports, folder sharing, dashboards, running user and dynamic dashboards.
- 4 min
- Includes a diagram
- Report types define available objects and relationships; custom report types add flexibility.
- Formats: tabular, summary, matrix, joined.
- Bucket fields, row-level and summary formulas, cross filters.
What it is
Reports list and summarize Salesforce data; dashboards display report results as charts and metrics. Administrators create report types, build reports and dashboards, and control who can see them with folders and the sharing model.
How it works
Report types
- A report type decides which objects, relationships and fields a report can use.
- Standard report types exist for most objects; custom report types let you choose objects and relationships.
- A related object can be included with related records (only parents that have children) or with or without related records.
- In a custom report type's field layout you choose which fields appear and can rename a field's display label; reports created earlier keep the old label.
- If a field is missing in the report builder, check that the report type includes it and that the user has field-level security to it.
Report formats
| Format | Use |
|---|---|
| Tabular | A simple list, like a spreadsheet |
| Summary | Rows grouped with subtotals |
| Matrix | Grouped by rows and columns |
| Joined | Several report blocks, possibly from different report types, in one report |
Report features
| Feature | Purpose |
|---|---|
| Filters and cross filters | Limit rows, including "with" or "without" related records |
| Bucket fields | Group values into categories without creating a field, such as amount ranges |
| Row-level formulas | Calculate a value per row |
| Summary formulas | Calculate on grouped totals, such as win rate |
| Charts | Visualize grouped data |
| Hide details | Show only groupings and totals |
| Subscriptions | Email results on a schedule or when conditions are met |
Reports and the sharing model
- Reports show only records the running user can see, based on the sharing model and field-level security.
- Reports and dashboards are stored in folders, shared with users, groups and roles as Viewer, Editor or Manager.
- Private folders hold a user's own reports.
Dashboards
| Concept | Meaning |
|---|---|
| Components | Charts, gauges, metrics and tables, each based on a source report |
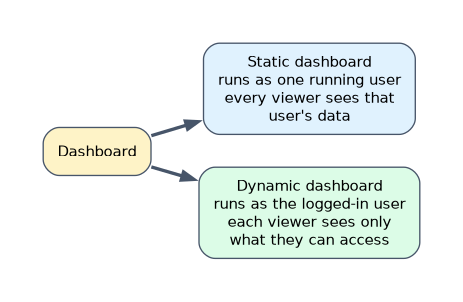
| Running user | The user whose access decides the data shown to all viewers |
| Dynamic dashboard | Runs as the logged-in user, so each viewer sees their own data; limited number per org by edition, for example 5 in Enterprise Edition and 10 in Unlimited and Performance Editions |
| View dashboard as | Lets permitted users choose the running user when viewing |
| Dashboard filters | Let viewers filter all components at once |
| Refresh and subscribe | Refresh data and email dashboards on a schedule |
A worked example: each sales rep should see a dashboard of only their own pipeline, but managers see their whole team. Build one dynamic dashboard that runs as the logged-in user, so access comes from each viewer's own sharing.
A static dashboard shows every viewer the running user's data. If viewers must see only what they can access, use a dynamic dashboard.
How the exam asks about this
- "Report on accounts that have no opportunities." A report type with or without related records, or a cross filter "without".
- "Group amounts into Small, Medium and Large without a new field." A bucket field.
- "Each rep sees only their own data on one dashboard." A dynamic dashboard.
What to remember for the exam
- Report types define available objects and relationships; custom report types add flexibility.
- Formats: tabular, summary, matrix, joined.
- Bucket fields, row-level and summary formulas, cross filters.
- Reports respect sharing and field-level security; folders have Viewer, Editor and Manager access.
- Dashboard running user versus dynamic dashboards (logged-in user).
Setting a powerful running user on a static dashboard can show viewers data they could not see in reports.
Common mistakes
Creating a new field just to group values. Use a bucket field.
Expecting a static dashboard to show each viewer different data. Use a dynamic dashboard.
Forgetting folder access. Users can't open reports in folders they can't see.
Check yourself
What does a report type control?
Which objects, relationships and fields are available to reports built on it.
What is a dynamic dashboard?
A dashboard that runs as the logged-in user, so each viewer sees data based on their own access.
Which report format combines blocks from different report types?
A joined report.
Topic 2 of 2 in Data and Analytics Management
Test yourself on Data and Analytics Management
The full Salesforce Platform Administrator question bank has 650 questions, with timed practice exams and an explanation for every answer.
This study guide is independent and is not affiliated with, endorsed by, or sponsored by Salesforce. Vendor names, certification names and exam codes are trademarks of their respective owners and are used for identification only.