Reporting and Communication · Topic 3 of 3
Security Operations Metrics
Measure security operations for CySA+ with detection time, response time, containment and remediation effectiveness, and avoid misleading numbers.
- 6 min
- Includes a diagram
- MTTD is the average time from the start of malicious activity to its detection.
- MTTR can mean respond, recover, repair or remediate, so the definition matters.
- Dwell time is how long an attacker was present in the environment before detection.
What it is
Metrics are measurements that show how well the security team detects, responds and fixes problems. Without them, a team cannot tell whether a change helped or whether the organisation is getting safer.
A key performance indicator (KPI) measures how well a process performs against a goal, such as time to respond. A key risk indicator (KRI) signals growing exposure, such as the number of critical vulnerabilities past their deadline.
How it works
Time based metrics
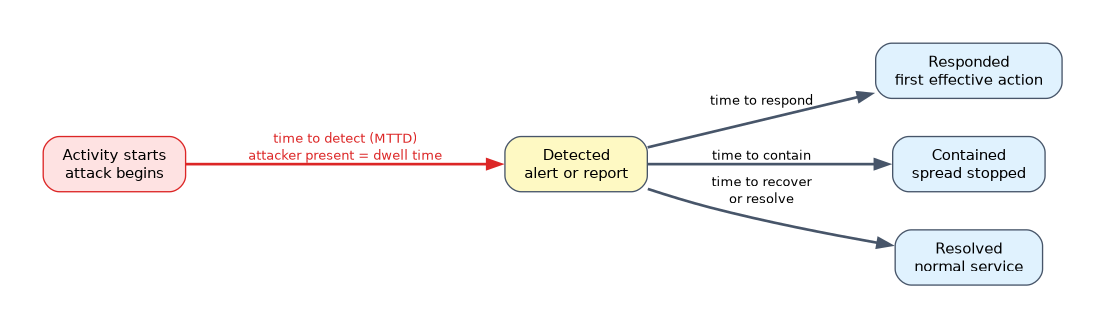 Each metric is a difference between two timestamps in the incident record.
| Metric | Meaning |
|---|---|
| Time to detect (mean time to detect, MTTD) | From the start of the activity to the moment it is detected |
| Time to acknowledge | From the alert being raised to an analyst picking it up |
| Time to respond (mean time to respond, MTTR) | From detection to the first effective response action |
| Time to contain | From detection to the spread being stopped |
| Time to recover or resolve | From detection to normal service |
| Dwell time | How long an attacker was present in the environment before being detected |
The letters MTTR are used for several meanings, including respond, recover, repair and remediate. A question or report should say which one, and the measurement start and end points must be defined the same way every time.
Mean means the average: add up the times and divide by the number of incidents.
Incident   Occurred   Detected   Contained   Detect time   Contain time (from detection)
A          08:00      08:30      09:30       30 min        60 min
B          10:00      12:00      12:30       120 min       30 min
C          13:00      13:15      14:15       15 min        60 min

MTTD     = (30 + 120 + 15) / 3 = 55 minutes
Mean time to contain = (60 + 30 + 60) / 3 = 50 minutes
Median detect time = 30 minutes
The mean of 55 minutes is pulled up by incident B. The median of 30 minutes tells a different story, which is why many teams also report the median or a high percentile.
Detection quality metrics
- True positive rate: the share of real attacks that the tools detect.
- False positive rate: the share of alerts that turned out to be harmless. A high rate wastes analyst time and causes alert fatigue.
- Alert volume and backlog: how many alerts arrive and how many wait for review.
- Detection coverage: how many relevant attack techniques have tested detections, often mapped to MITRE ATT&CK (Adversarial Tactics, Techniques, and Common Knowledge).
- Source of detection: found by tools, found by a user report or found by an outside party. Detection by an outside party is a warning sign.
Incident metrics
- Number of incidents by type and severity.
- Repeat incidents of the same type.
- Percent of incidents handled within the service target.
- Cost and downtime per incident, where measured.
- Escalation rate.
Phishing campaign metrics
The phishing click rate is the number of users who clicked divided by the number of users targeted, shown as a percentage. If 18 of 240 users clicked, the rate is 18 divided by 240, which is 7.5%.
Track it with related measures:
- Report rate: users who reported the message divided by users targeted. A rising report rate is a good sign even if some users still click.
- Credential submission rate: users who entered a password on the fake page.
- Time to first report: how fast the first user alerted security.
Compare results by department and over successive campaigns. Keep the difficulty of the tests comparable, and use the numbers to target training, not to punish people.
Remediation effectiveness
Remediation effectiveness shows whether vulnerabilities and incident actions are really being fixed, and whether the fixes hold.
| Metric | What it tells you |
|---|---|
| Percent of vulnerabilities fixed within the target time | Whether the service target is met, by severity |
| Mean time to remediate | How fast fixes happen |
| Age of open critical items | How long serious risk is exposed |
| Reopened or recurring findings | Fixes that failed or were undone |
| Patch compliance | Share of systems with current updates |
| Exceptions open and overdue | Accepted risk, and whether reviews happen |
| Scan coverage | Share of assets assessed recently |
| Closure verified by rescan | Whether closed items were proven closed |
A high recurrence rate means that remediation is not effective, even if many tickets are closed.
Using metrics well
- Define each metric. Write the formula, data source and start and end events.
- Choose a few that match goals. A small, meaningful set beats a long list.
- Track trends over time, not only single values.
- Tailor the view to the audience, as covered in the reporting pages.
- Pair with context. A rise in detected incidents may reflect better monitoring, not worse security.
- Review and improve. Use results to adjust staffing, tools, playbooks and training.
Weak practices include chasing a number so that it looks good (for example, closing alerts quickly without investigation), comparing teams with different definitions, and reporting averages that hide extreme cases.
When a question gives timestamps, identify which two events the metric is measuring before doing any arithmetic. Detection time starts when the activity began, and response time starts when it was detected.
What to remember for the exam
- MTTD is the average time from the start of malicious activity to its detection.
- MTTR can mean respond, recover, repair or remediate, so the definition matters.
- Dwell time is how long an attacker was present in the environment before detection.
- A mean is the sum of values divided by the count, and a median is less affected by outliers.
- A KPI measures performance, and a KRI signals rising risk.
- A high false positive rate causes alert fatigue.
- Remediation effectiveness includes percent fixed within target, age of open items and recurrence.
- Closed tickets are not proof of success unless the fix was verified.
- Metrics need clear definitions and consistent timestamps.
Common mistakes
Mixing the start points. Detection time is measured from when the activity began, not from when the alert arrived.
Trusting averages alone. A few long incidents can distort the mean, so check the median and the worst cases.
Rewarding speed over quality. Closing alerts fast without investigation lowers the numbers and raises the risk.
Counting closed tickets as fixed. If findings return in the next scan, remediation was not effective.
Tracking too many metrics. A crowded dashboard hides the few measures that drive decisions.
Check yourself
What does MTTD measure?
The average time between the start of malicious activity and its detection.
Why report the median as well as the mean response time?
A few very long incidents can distort the mean, while the median shows the typical case.
Which metric shows that fixes are failing even though tickets are being closed?
A high rate of reopened or recurring findings.
Topic 3 of 3 in Reporting and Communication
Test yourself on Reporting and Communication
The full CompTIA CySA+ CS0-004 question bank has 654 questions, with timed practice exams and an explanation for every answer.
This study guide is independent and is not affiliated with, endorsed by, or sponsored by CompTIA. Vendor names, certification names and exam codes are trademarks of their respective owners and are used for identification only.