Performance Optimization · Topic 1 of 7
Troubleshooting Underperforming Queries and the Query Profile
Find slow Snowflake queries in Query History and ACCOUNT_USAGE, read the Query Profile, spot spilling, poor pruning and exploding joins, and fix the cause.
- 5 min
- Includes a diagram
- Find queries with Query History,
INFORMATION_SCHEMA.QUERY_HISTORY(7 days) andACCOUNT_USAGE.QUERY_HISTORY(365 days). - Query Profile shows operators, Most Expensive Nodes and statistics for pruning, spilling and cache.
- Spilling points to memory (size up); partitions scanned near total points to pruning; queued time points to concurrency (scale out); exploding join points to a bad join.
What it is
Troubleshooting a slow query is a short loop: find the query, measure where its time went, name the root cause, then apply the matching fix. The exam gives you symptoms (spilling, many partitions scanned, queued time) and asks for the single best remedy.
Snowflake gives you three kinds of telemetry for this loop: Query History and the QUERY_HISTORY views for finding queries, the Query Profile for seeing inside one query, and event tables for logs and traces from code that runs inside Snowflake.
How it works
Identify the underperforming query
| Source | Retention | Notes |
|---|---|---|
| Snowsight Query History (Monitoring) | Last 14 days | Filter by user, warehouse, duration, status, query tag; Grouped Queries groups by parameterized query hash |
INFORMATION_SCHEMA.QUERY_HISTORY table function | Last 7 days | Near real time, no ingestion lag |
SNOWFLAKE.ACCOUNT_USAGE.QUERY_HISTORY view | 365 days | Account wide, can lag by up to about 45 minutes |
Useful columns for spotting trouble:
TOTAL_ELAPSED_TIME,COMPILATION_TIME,EXECUTION_TIME: where the wall clock time went.QUEUED_OVERLOAD_TIME,QUEUED_PROVISIONING_TIME: time waiting for a busy or starting warehouse.BYTES_SCANNED,PARTITIONS_SCANNED,PARTITIONS_TOTAL: how much data was read, and how well pruning worked.BYTES_SPILLED_TO_LOCAL_STORAGE,BYTES_SPILLED_TO_REMOTE_STORAGE: memory pressure.PERCENTAGE_SCANNED_FROM_CACHE: how much came from the warehouse local disk cache.
SELECT query_id, warehouse_name, total_elapsed_time, bytes_spilled_to_remote_storage
FROM snowflake.account_usage.query_history
WHERE start_time > DATEADD('day', -7, CURRENT_TIMESTAMP())
ORDER BY total_elapsed_time DESC
LIMIT 20;Set a QUERY_TAG on sessions or jobs. Tags let you group history by pipeline or team and find which workload owns the slow query.
Outline the telemetry around the operation
- Query Profile: the execution plan as a graph of operators, with each node's share of total time.
- Query Insights: a pane in the profile (also the
QUERY_INSIGHTSview) that lists conditions affecting performance, each with a recommendation. GET_QUERY_OPERATOR_STATS: a table function that returns operator level statistics for a finished query as rows, so you can analyze the profile with SQL.- Event tables: store logs, traces and metrics emitted by UDFs, stored procedures, tasks and other code. Levels such as
LOG_LEVELandTRACE_LEVELdecide what is captured. - Warehouse and account views:
WAREHOUSE_LOAD_HISTORYandWAREHOUSE_METERING_HISTORYcover the compute around the query.
Read the Query Profile
The profile has a Most Expensive Nodes list (nodes using at least 1 percent of time) and a Statistics pane.
| Statistic | What it tells you |
|---|---|
| Partitions scanned vs partitions total | Pruning quality; scanned close to total means a near full table scan |
| Bytes scanned, percentage from cache | Volume read and how much was served from the local disk cache |
| Bytes spilled to local / remote storage | Intermediate data did not fit in memory |
| Time categories | Processing, local and remote disk I/O, network, synchronization, initialization |
Identify the root cause
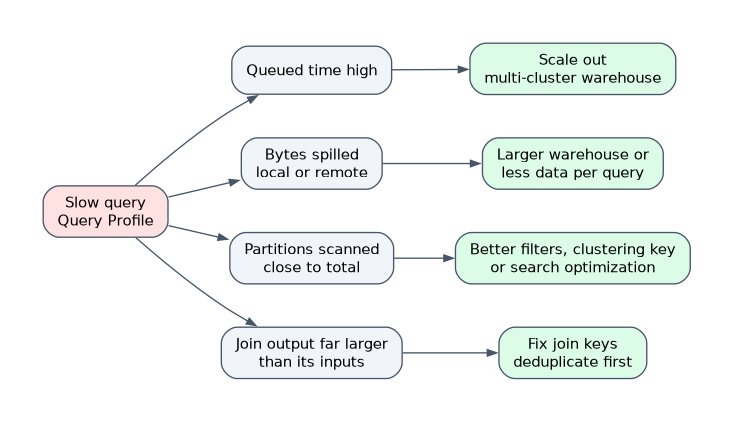
| Symptom | Likely cause | Fix |
|---|---|---|
| Spilling, especially remote | Operation (join, sort, aggregate) too large for warehouse memory | Larger warehouse, or process less data per query, or a Snowpark-optimized warehouse for memory heavy code |
| Partitions scanned close to total | Filter does not match how data is stored | Better filters, clustering key, or search optimization for point lookups |
| Join output has far more rows than its inputs | Exploding join: missing or non unique join keys, accidental cartesian product | Fix the join condition, deduplicate first |
| High queued time | Too many concurrent queries for the warehouse | Multi-cluster warehouse (scale out) |
| High compilation time | Very complex SQL or deeply nested views | Simplify, break into steps |
| Low cache percentage on a repeated workload | Warehouse was suspended, so its local cache was lost | Keep the warehouse warm if the workload repeats; review AUTO_SUSPEND |
Increase efficiency
- Select only the columns you need. Snowflake is columnar, so
SELECT *reads every column. - Filter early and on columns that prune well, such as dates the table is naturally ordered by.
- Use
UNION ALLinstead ofUNIONwhen duplicates are acceptable, becauseUNIONadds a distinct step. - Avoid unnecessary sorting.
ORDER BYon a large result is expensive; sort only the final, small result. - Use approximate functions such as
APPROX_COUNT_DISTINCTwhen exact counts are not needed. - Materialize repeated intermediate results in a temporary or transient table rather than recomputing a heavy subquery many times.
- Reuse results. Identical queries can be served from the result cache at no warehouse cost.
Resizing a warehouse does not fix a bad join or a full scan caused by poor pruning. It only adds memory and CPU. Match the fix to the cause.
Common mistakes
Scaling up first. A bigger warehouse helps spilling and heavy processing, but not queuing (use more clusters) or poor pruning (improve data layout).
Relying on the Snowsight history window. Query History in Snowsight covers 14 days. For older analysis use ACCOUNT_USAGE.QUERY_HISTORY.
Expecting ACCOUNT_USAGE to be real time. It lags. For a query that just ran, use the Information Schema function or Snowsight.
Reading cache percentage as the result cache. The profile statistic is about the warehouse local disk cache, not the result cache.
What to remember for the exam
- Find queries with Query History,
INFORMATION_SCHEMA.QUERY_HISTORY(7 days) andACCOUNT_USAGE.QUERY_HISTORY(365 days). - Query Profile shows operators, Most Expensive Nodes and statistics for pruning, spilling and cache.
- Spilling points to memory (size up); partitions scanned near total points to pruning; queued time points to concurrency (scale out); exploding join points to a bad join.
GET_QUERY_OPERATOR_STATSgives profile data as SQL; event tables hold logs and traces from code.- Efficiency basics: fewer columns, early filters,
UNION ALL, less sorting, approximate functions.
Check yourself
A profile shows large bytes spilled to remote storage. What is the usual first fix?
Give the query more memory with a larger warehouse, or reduce the data it processes at once.
Which two columns show how well a query pruned micro-partitions?
PARTITIONS_SCANNED and PARTITIONS_TOTAL; a scanned count close to the total means poor pruning.
Where do you query query history older than 14 days?
SNOWFLAKE.ACCOUNT_USAGE.QUERY_HISTORY, which keeps 365 days of history.
Topic 1 of 7 in Performance Optimization
Test yourself on Performance Optimization
The full Snowflake DEA-C02 question bank has 709 questions, with timed practice exams and an explanation for every answer.
This study guide is independent and is not affiliated with, endorsed by, or sponsored by Snowflake. Vendor names, certification names and exam codes are trademarks of their respective owners and are used for identification only.