Optimize endpoint operations · Topic 3 of 4
Reporting, Workbooks and Endpoint Analytics
MD-102 reporting: Intune reports and exports, Azure Monitor workbooks, diagnostic settings, the data warehouse, and Endpoint analytics scores and reliability.
- 5 min
- Includes a diagram
- Intune reports are operational, organizational, historical and specialist, and can be exported to CSV.
- Diagnostic settings send AuditLogs, OperationalLogs and DeviceComplianceOrg (and device data) to Log Analytics. Compliance and device data export daily and can lag up to 48 hours.
- The Data Warehouse uses an OData feed and has daily refreshed history.
What it is
Intune records a great deal about devices, policies and users, and gives you several ways to see it. Reports in the admin center cover most daily needs. Diagnostic settings send logs to Azure Monitor for workbooks and dashboards. The Intune Data Warehouse supports history and Power BI. Endpoint analytics scores the user experience of devices: startup time, application reliability and readiness.
How it works
Intune reports
Find them under Reports and in each area's Monitor page. Report groups:
| Group | Purpose |
|---|---|
| Operational | Near real time, for help desk and admins to act on, such as enrollment failures |
| Organizational | Summary views for managers, such as device compliance and management state |
| Historical | Trends over time |
| Specialist | Raw data for custom reports |
Reports support search, sorting, paging and filters, and you can customise columns and saved views. Export creates a CSV download that works for large tenants, and the Graph export jobs API automates exports. The Home page shows a dashboard of tiles, and you can pin your own views.
Azure Monitor workbooks and diagnostic settings
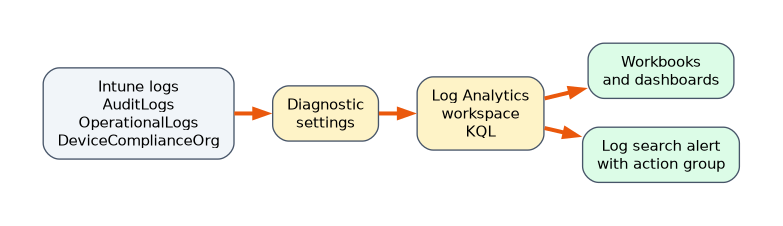 To go beyond built in views, send Intune logs to Azure Monitor. Go to Reports, Diagnostic settings, and add a setting that sends logs to a Log Analytics workspace, a storage account or Event Hubs.
| Log category | Content |
|---|---|
| AuditLogs | Who changed what in Intune |
| OperationalLogs | Enrollment results and noncompliant devices |
| DeviceComplianceOrg | The compliance organizational report |
| Devices | Device inventory report data |
Audit and operational logs arrive immediately. Device compliance organizational and Intune devices data are exported once every 24 hours and can take up to 48 hours to appear, so dashboards should not assume a fixed time. Data usually shows in Azure Monitor within 30 minutes of arrival.
In Log Analytics you can write KQL, build Azure Monitor Workbooks, create alerts and feed Power BI. Windows Update for Business reports use their own Log Analytics workspace and workbook.
Intune Data Warehouse
The Data Warehouse is a separate historical store with a daily refresh and an OData feed. In Reports, Intune Data warehouse, copy the feed URL and use the OData feed connector in Power BI, optionally limiting history with maxHistoryDays. It has Intune data only. For co-managed devices, Configuration Manager data comes from elsewhere. The old v1 Power BI connector is retiring, so use the v2 or OData connector.
Endpoint analytics
Endpoint analytics measures how devices perform for users, and recommends fixes.
Setup: Windows devices must be managed by Intune (or Configuration Manager with tenant attach), run the Connected User Experiences and Telemetry (DiagTrack) service and reach Microsoft endpoints. The first run creates a Windows health monitoring policy to turn on data collection. Data appears within about 24 hours of a restart, and each device needs at least one restart for startup metrics.
| Report | What it measures |
|---|---|
| Startup performance | Boot and sign in time. A startup score of 0 to 100 and the processes that slow startup. Views include Model performance, Device performance, Startup processes and Restart frequency |
| Application reliability | App crashes and hangs. The score uses mean time to failure and total usage over 14 days |
| Work from anywhere | Readiness of devices for cloud management and Windows 11 |
| Resource performance | CPU and RAM scores, and the effect of an upgrade |
| Battery health | Capacity and runtime scores for laptops |
| Recommended software | Suggestions to improve scores |
The overall score is a weighted average of the startup, application reliability and work from anywhere scores. A baseline lets you compare your score with others. Use Model performance to choose which hardware models to replace first, and use Device performance to find individual problem devices. Reliability analysis also covers restart frequency and application reliability trends, so you can see which apps crash most. The enhanced device timeline and anomalies are Advanced Analytics features.
Choosing the right source
| Question | Source |
|---|---|
| Which devices failed to enroll today? | Enrollment failures report |
| How many devices are compliant, by policy? | Device compliance report |
| Who changed this policy last week? | Audit logs |
| Build a custom dashboard of compliance over time | Diagnostic settings, Log Analytics and a workbook |
| Long term history in Power BI | Data Warehouse |
| Which hardware models have the slowest startup? | Endpoint analytics, Model performance |
A worked scenario
An operations manager wants to replace the worst laptops. The admin opens Endpoint analytics, Startup performance, Model performance, and sees one model with a startup score of 41. Application reliability shows that a line of business app crashes most often. For executives, she routes DeviceComplianceOrg logs to Log Analytics and builds a workbook, knowing that the data lags by up to two days. A weekly CSV export goes to the audit team.
What to remember for the exam
- Intune reports are operational, organizational, historical and specialist, and can be exported to CSV.
- Diagnostic settings send AuditLogs, OperationalLogs and DeviceComplianceOrg (and device data) to Log Analytics. Compliance and device data export daily and can lag up to 48 hours.
- The Data Warehouse uses an OData feed and has daily refreshed history.
- Endpoint analytics needs DiagTrack, a restart per device, and reports startup, reliability and work from anywhere. Overall score is a weighted average.
- Model performance helps choose hardware to replace.
Real time questions use operational reports. Trend and dashboard questions use Log Analytics workbooks or the Data Warehouse.
How the exam asks about this
- "Build a custom compliance dashboard." Diagnostic settings to Log Analytics and a workbook.
- "Which hardware models start slowest?" Endpoint analytics, Startup performance, Model performance.
- "Why do device compliance logs appear a day late in Log Analytics?" They are exported once every 24 hours.
- "Pull Intune history into Power BI." The Data Warehouse OData feed.
Common mistakes
Expecting instant compliance logs in Log Analytics. They lag.
Looking for data before devices restart. Startup scores need a restart.
Disabling DiagTrack. Endpoint analytics stops collecting.
Confusing Endpoint analytics scores with compliance.
Check yourself
Which logs go to Azure Monitor from Intune?
AuditLogs, OperationalLogs, DeviceComplianceOrg and device inventory data.
What does the startup score measure?
Boot and sign in time, from 0 to 100.
What do you need to do before startup data appears for a device?
Restart it at least once.
Topic 3 of 4 in Optimize endpoint operations
Test yourself on Optimize endpoint operations
The full Microsoft MD-102 question bank has 658 questions, with timed practice exams and an explanation for every answer.
This study guide is independent and is not affiliated with, endorsed by, or sponsored by Microsoft. Vendor names, certification names and exam codes are trademarks of their respective owners and are used for identification only.