Design identity, governance, and monitoring solutions · Topic 1 of 6
Logging, Log Routing and Monitoring Solutions
AZ-305 monitoring design: Azure Monitor and Log Analytics, table plans and retention, routing logs with diagnostic settings and Event Hubs.
- 5 min
- Includes a diagram
- Logs go to Log Analytics, and metrics are available without setup. Application Insights is workspace based.
- Interactive retention is 30 days to 2 years on the Analytics plan, and total retention can reach 12 years with long term retention. Basic is 30 days interactive.
- Diagnostic settings route to Log Analytics, storage, Event Hubs or partners. Event Hubs streams to external tools.
What it is
Azure Monitor is the platform for collecting, analysing and acting on telemetry. Metrics are numeric time series. Logs are records stored in a Log Analytics workspace and queried with KQL. As an architect you decide what to collect, where to store it, how long to keep it, where to route it and which tool gives the insight (Application Insights, VM insights, Defender for Cloud, Sentinel). Those four decisions are the heart of this topic.
How it works
Choosing a logging solution
| Need | Recommendation |
|---|---|
| Central query and alerting across Azure resources | Log Analytics workspace in Azure Monitor |
| Application performance and traces | Application Insights (workspace based) |
| Metrics, near real time and cheap | Azure Monitor Metrics (a platform feature, no setup) |
| Security events and detection | Microsoft Sentinel on a workspace, plus Defender for Cloud |
| Long term retention for audit | Log Analytics long term retention, or an export to storage |
| Stream to another system | Event Hubs |
Workspace design: use one workspace per region and environment boundary where you can, because each workspace is a billing, access and data residency boundary. Use resource context RBAC so teams see only their resources' logs. A single workspace is simpler to query. Separate workspaces help with data sovereignty, different retention or cost allocation.
Table plans and retention
Each Log Analytics table has a plan.
| Plan | Use | Notes |
|---|---|---|
| Analytics | Active monitoring, alerting, all features | Interactive retention 30 days to 2 years |
| Basic | Troubleshooting and verbose logs | Cheaper ingestion, 30 days interactive, limited queries and simple alerts |
| Auxiliary | High volume audit or verbose data | Cheapest ingestion, slow queries, no alerts or export rules |
On any plan you can keep data in long term retention for up to 12 years in total, and query it later with a search job. Plan retention by compliance need: keep 90 days hot for operations and years in long term retention for audit. A workspace commitment tier lowers the per GB price at high volume, and a data collection rule (DCR) can filter or transform data before ingestion to cut cost.
Routing logs
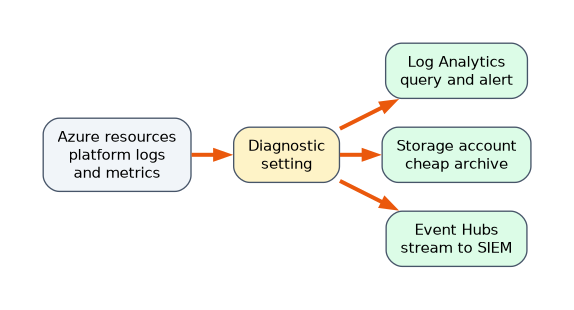 Diagnostic settings send a resource's platform logs and metrics to one or more destinations.
| Destination | Use |
|---|---|
| Log Analytics workspace | Query, alert, visualise |
| Storage account | Cheap archive, with lifecycle management |
| Event Hubs | Stream to a SIEM, Splunk or another service |
| Partner solutions | Integrations such as Datadog |
The Activity log records control plane operations in a subscription and also routes through a diagnostic setting. For VMs, Azure Monitor Agent (AMA) with data collection rules replaces the retired legacy Log Analytics agent and the Windows diagnostics extension, and uses a managed identity instead of workspace keys. Use Azure Arc to bring AMA to on premises and other cloud servers. Event Hubs is the right route when logs must reach a third party tool in near real time. Data export rules continuously copy a workspace's tables to storage or Event Hubs.
Choosing monitoring tools
| Scenario | Tool |
|---|---|
| Slow web app, which method is slow | Application Insights, with the Profiler for method level time and the Snapshot Debugger for exception state |
| Dependency map and process level VM data | VM insights |
| Container health on AKS | Container insights and Managed Prometheus with Managed Grafana |
| Is the endpoint reachable | Availability tests in Application Insights |
| Network path and latency | Network Watcher, Connection Monitor |
| Resource health and service incidents | Resource Health, Service Health |
| Cost anomalies | Microsoft Cost Management budgets and alerts |
| Vendor neutral instrumentation | OpenTelemetry with the Azure Monitor distro |
Alerts can be metric, log search, or activity log alerts. They trigger action groups that send email, SMS, webhooks, Logic Apps or runbooks. Workbooks and dashboards present the results. Use alert processing rules to suppress alerts during maintenance.
A worked scenario
A retailer runs 400 VMs and wants central logs searchable for 90 days and kept 7 years for audit, with firewall logs also fed to a third party SIEM in near real time. The architect proposes Azure Monitor Agent with DCRs to a regional Log Analytics workspace, the Analytics plan with 90 days interactive retention and long term retention up to 7 years, and a diagnostic setting on the firewall that sends logs to the workspace and to an Event Hub for the SIEM. High volume verbose logs move to the Basic plan.
What to remember for the exam
- Logs go to Log Analytics, and metrics are available without setup. Application Insights is workspace based.
- Interactive retention is 30 days to 2 years on the Analytics plan, and total retention can reach 12 years with long term retention. Basic is 30 days interactive.
- Diagnostic settings route to Log Analytics, storage, Event Hubs or partners. Event Hubs streams to external tools.
- Azure Monitor Agent with DCRs replaces the legacy agent, can filter before ingestion and uses managed identity. Azure Arc extends it to non Azure servers.
- Application Insights Profiler gives method level timing. Availability tests only prove reachability.
A phrase like "stream to a third party SIEM" means Event Hubs. "Archive cheaply for years" means storage or long term retention.
How the exam asks about this
- "Keep logs for 7 years at the lowest cost, but still query them occasionally." Long term retention with search jobs.
- "Send platform logs to Splunk." A diagnostic setting to Event Hubs.
- "Filter events before ingestion and stop using workspace keys." Azure Monitor Agent with a DCR.
- "Find which method in the API is slow in production." Application Insights Profiler.
Common mistakes
Using the legacy agent. Azure Monitor Agent replaces it.
One workspace for everything regardless of residency. The workspace is a data boundary.
Sending verbose data to the Analytics plan. Basic or Auxiliary costs less.
Expecting alerts on the Auxiliary plan. It has none.
Check yourself
What is the maximum total retention in Log Analytics?
12 years, using long term retention.
Which destination streams logs to a third party SIEM?
Event Hubs.
Which agent replaces the legacy Log Analytics agent?
Azure Monitor Agent with data collection rules.
Topic 1 of 6 in Design identity, governance, and monitoring solutions
Test yourself on Design identity, governance, and monitoring solutions
The full Microsoft AZ-305 question bank has 755 questions, with timed practice exams and an explanation for every answer.
This study guide is independent and is not affiliated with, endorsed by, or sponsored by Microsoft. Vendor names, certification names and exam codes are trademarks of their respective owners and are used for identification only.