Management and Troubleshooting · Topic 2 of 6
Packet Capture and Packet Tracer
Learn how to capture packets on FTD with the FMC and the CLI, and how Packet Tracer simulates a packet to show each processing phase and the result.
- 4 min
- Includes a diagram
- A capture records real packets, and Packet Tracer simulates one packet.
- The FMC and the CLI can both do captures and Packet Tracer runs.
- The CLI uses
capture NAME interface NAME match ...to start andshow capture NAMEto read.
What it is
Packet capture records real packets, and Packet Tracer simulates one packet to show how the firewall would treat it.
A capture is proof of what arrived and what left. It is the tool to use when you need to see if traffic reaches the firewall at all.
Packet Tracer builds a test packet from values you give, and it passes the packet through the processing steps without sending it. It shows which step allows or drops it.
How it works
You can use the FMC or the device CLI, and both give the same kind of answers.
Capture in the FMC
The FMC has a packet capture tool in its troubleshooting area for a device. You pick the device, choose an interface, set a name and add match values such as the protocol and the addresses. You then start the capture.
When it ends, you can view and download the result as a pcap file for a tool such as Wireshark. This avoids logging in to the device.
Capture on the device CLI
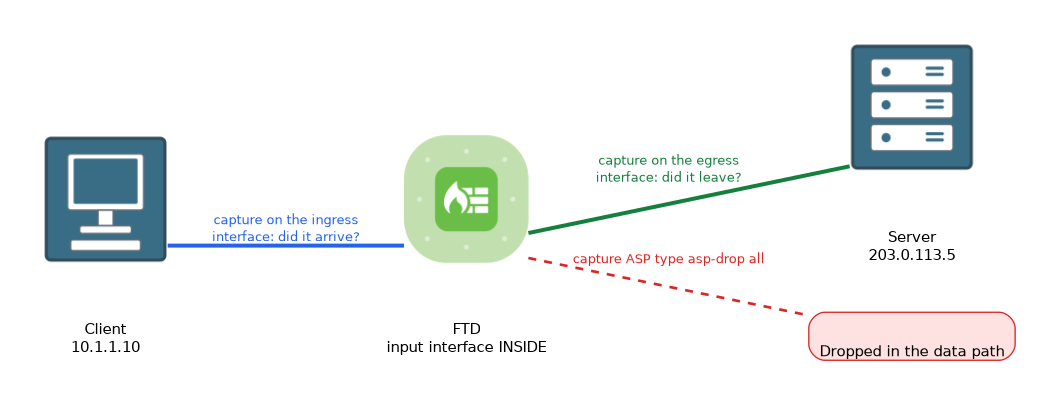 On the FTD CLI, the
 capture command works on a named interface.
> capture CAP1 interface INSIDE match tcp host 10.1.1.10 host 203.0.113.5 eq 80
> show capture CAP1
> no capture CAP1
show capture lists captures or shows the packets in one. no capture removes it and frees the buffer. Match values keep the capture small, because the buffer is limited.
A capture can also record drops in the data path. This one shows packets dropped by the accelerated security path, together with the reason.
> capture ASP type asp-drop all
> show capture ASP
The trace option adds a trace of each captured packet. You then view a packet with its trace.
> capture CAP2 interface INSIDE trace detail trace-count 20 match ip any any
> show capture CAP2 packet-number 1 trace
Capture at the lower level
The capture-traffic command is another capture tool on the device CLI. It is separate from capture, and it asks which interface to use and which tcpdump style options to apply.
Packet Tracer
You give an input interface, a protocol, and source and destination addresses and ports.
> packet-tracer input INSIDE tcp 10.1.1.10 12345 203.0.113.5 80The output lists phases. You will see names such as ACCESS-LIST, NAT, and route lookup, with a result of allow or drop at the end. On FTD there are also phases for the inspection engine.
When a packet is dropped, the phase that dropped it and the reason are shown. Packet Tracer is also in the FMC, which makes it easy to run without the CLI.
Which tool to use
| Question | Tool |
|---|---|
| Does the packet reach the firewall? | Capture on the ingress interface |
| Does the packet leave the firewall? | Capture on the egress interface |
| Which rule or phase blocks it? | Packet Tracer |
| Why did the data path drop it? | Capture with type asp-drop |
Good habits
Limit captures with match values and short durations. Remove a capture when you finish. Packet Tracer shows the result for a test packet, so confirm it with a capture of real traffic if the user still has a problem.
What to remember for the exam
Seven facts cover the usual questions.
- A capture records real packets, and Packet Tracer simulates one packet.
- The FMC and the CLI can both do captures and Packet Tracer runs.
- The CLI uses
capture NAME interface NAME match ...to start andshow capture NAMEto read. no capture NAMEremoves a capture.capture NAME type asp-drop allrecords packets dropped in the data path.- The
traceoption records the processing path of captured packets. - Packet Tracer reports the phase that allows or drops the packet.
To check whether traffic reaches a firewall at all, capture on the ingress interface first.
Common mistakes
These four mistakes are common here.
Capturing everything. The buffer is small, so use match values.
Forgetting to stop a capture. Remove it with no capture when you have finished.
Trusting only Packet Tracer. It tests a made up packet and may not match real traffic.
Capturing on one interface only. You then cannot tell if the firewall dropped the packet.
A capture with no match values on a busy firewall can use a lot of resources. Always narrow it down.
Check yourself
Work through these three questions.
What is the difference between a capture and Packet Tracer?
A capture records real packets, and Packet Tracer simulates one packet and shows how each phase treats it.
Which capture type records packets dropped in the data path?
type asp-drop, as incapture ASP type asp-drop all.How do you remove a capture from the device?
Use
no capturefollowed by the capture name.
Topic 2 of 6 in Management and Troubleshooting
Test yourself on Management and Troubleshooting
The full Cisco CCNP 300-710 SNCF question bank has 865 questions, with timed practice exams and an explanation for every answer.
This study guide is independent and is not affiliated with, endorsed by, or sponsored by Cisco. Vendor names, certification names and exam codes are trademarks of their respective owners and are used for identification only.