Performance Optimization, Querying, and Transformation · Topic 1 of 6
Query Profile and Query Insights
Read the Snowflake Query Profile and Query Insights to spot bytes spilled to storage, inefficient pruning and exploding joins, and pick the right fix.
- 6 min
- Includes a diagram
- Query Profile is in Snowsight Query History. Start with Most Expensive Nodes.
- Query Insights flag causes such as remote spilling, filter not selective, exploding join and long queue time. SQL access is the
QUERY_INSIGHTSview in ACCOUNT_USAGE. - Spill order is memory, then local storage, then remote storage. Fix by scaling up or processing less data.
What it is
The Query Profile is the graphical execution plan of a query in Snowsight. It shows each operator (TableScan, Filter, Join, Aggregate, Sort and so on) as a node, the rows that flow between nodes, and statistics for the whole query and each node.
Query Insights are notes Snowflake adds to a query when it detects a condition that can hurt performance. Each insight names the cause, points to the part of the query involved and, where it can, suggests a next step.
Together they answer the exam's core question: why is this query slow, and which fix matches the cause?
How it works
Where to find the profile
In Snowsight, open Monitoring > Query History, select a query and open the Query Profile tab. Nodes with insights are highlighted, and a Query Insights pane lists each one. The same insights are available in SQL through the SNOWFLAKE.ACCOUNT_USAGE.QUERY_INSIGHTS view.
The profile works for running and completed queries. For a programmatic view of the same per-operator numbers, use the GET_QUERY_OPERATOR_STATS table function with a query ID.
The four parts to read
| Part | What it shows | Why it matters |
|---|---|---|
| Most Expensive Nodes | Operators ranked by share of execution time | Start tuning at the top node |
| Profile Overview | Time split into Processing, Local Disk IO, Remote Disk IO, Network Communication, Synchronization and Initialization | High disk IO usually means spilling or large scans |
| Statistics | Partitions scanned and total, bytes scanned, bytes spilled, rows | Shows pruning and memory pressure |
| Operator node detail | Rows in and out, join condition, filter predicate | Finds exploding joins and weak filters |
Bytes spilled to storage
When an operator such as a sort, join or aggregation needs more memory than the warehouse has, Snowflake writes intermediate data out. It goes first to the warehouse's local storage (SSD) and, if that fills, to remote storage (cloud object storage).
The Statistics pane shows Bytes spilled to local storage and Bytes spilled to remote storage. Remote spilling is far slower, and Query Insights reports it as Remote spilling.
Fixes, from most to least common:
- Use a larger warehouse. A bigger size has more memory and local storage per cluster.
- Process less data at once: filter earlier, select fewer columns, or split the job into smaller batches.
- Reduce the work an operator holds in memory, for example by aggregating before a join.
Spilling is a memory problem, so the fix is to scale up (larger size). Scaling out with more clusters adds concurrency, not memory per query.
Inefficient pruning
Snowflake stores every table in micro-partitions and keeps min and max values for each column in metadata. Pruning skips micro-partitions whose ranges cannot match the filter, so fewer bytes are read.
Compare Partitions scanned with Partitions total on the TableScan node. If a selective filter still scans almost every partition, pruning is poor. Query Insights may say Filter not selective, No filter on table scan or LIKE filter with leading wildcard.
Common causes and fixes:
- The data is not ordered by the filter column, so every partition holds a wide range. Define a clustering key on large tables, or load data already sorted.
- The filter wraps the column in a function or cast, which can stop pruning. Filter on the raw column where you can.
- The query is a selective point lookup on a column with many distinct values. The search optimization service is the better fit.
Exploding joins
A join "explodes" when it produces far more rows than its inputs. The usual cause is a missing join condition (a cartesian product) or a condition on a column that is not unique on either side, so each row matches many rows.
In the profile, the Join node shows many more output rows than input rows, and the time is spent there. Query Insights reports Join with no join condition, Join with inefficient join condition or Exploding join.
Fix the SQL rather than the warehouse:
- Add or correct the join keys so the relationship is one to one or one to many as intended.
- Deduplicate or aggregate one side before the join.
- Check for an accidental
CROSS JOINor a comma join without aWHEREcondition.
The tuning loop
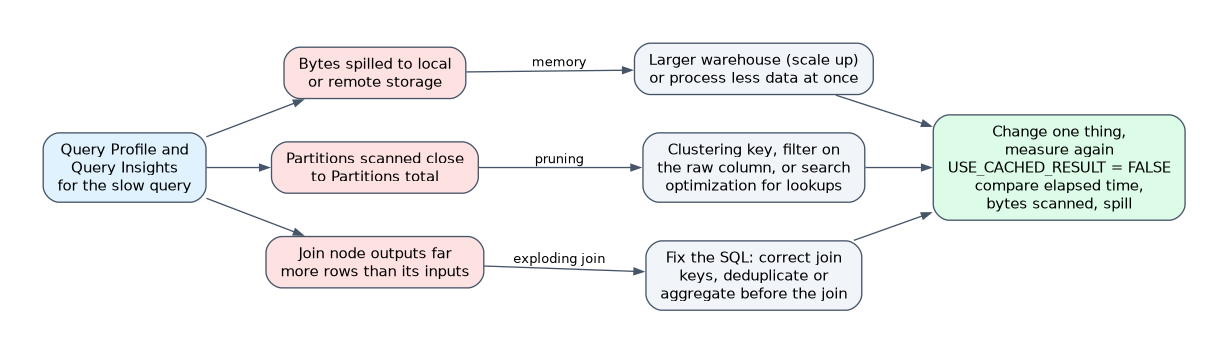 Evaluate, change one thing, then measure again. Compare total elapsed time, bytes scanned and spill figures between runs. Turn off the result cache in your session (
ALTER SESSION SET USE_CACHED_RESULT = FALSE) while testing, or a repeat run returns instantly and proves nothing.
Common mistakes
Scaling out to fix spilling. Adding clusters to a multi cluster warehouse helps when many queries wait, not when one query runs out of memory. Spilling needs a larger warehouse size or less data per query.
Resizing the warehouse for an exploding join. A larger warehouse only produces the wrong row explosion faster. Fix the join condition first.
Blaming the warehouse for a full scan. If partitions scanned equals partitions total on a selective filter, the table layout or the filter is the problem. Clustering, search optimization or a rewritten predicate is the fix.
Local spilling alone is not always a crisis, but remote spilling is a clear sign the warehouse is too small for that query. On the exam, "bytes spilled to remote storage" almost always leads to "increase the warehouse size".
What to remember for the exam
- Query Profile is in Snowsight Query History. Start with Most Expensive Nodes.
- Query Insights flag causes such as remote spilling, filter not selective, exploding join and long queue time. SQL access is the
QUERY_INSIGHTSview in ACCOUNT_USAGE. - Spill order is memory, then local storage, then remote storage. Fix by scaling up or processing less data.
- Poor pruning shows as partitions scanned close to partitions total. Fix with clustering keys, search optimization or a better filter.
- An exploding join shows output rows much larger than input rows at the Join node. Fix the join condition.
- Disable
USE_CACHED_RESULTwhen timing tuning tests.
Check yourself
A query shows a large value for bytes spilled to remote storage. What is the usual fix?
Run it on a larger warehouse size, or reduce the data each step processes, because the query is short of memory.
How does the Query Profile reveal inefficient pruning?
The TableScan node shows partitions scanned close to partitions total even though the query has a selective filter.
A Join node outputs millions of rows from two small inputs. What should you check first?
The join condition, because a missing or non-unique join key causes an exploding join.
Topic 1 of 6 in Performance Optimization, Querying, and Transformation
Test yourself on Performance Optimization, Querying, and Transformation
The full Snowflake SnowPro Core COF-C03 question bank has 845 questions, with timed practice exams and an explanation for every answer.
This study guide is independent and is not affiliated with, endorsed by, or sponsored by Snowflake. Vendor names, certification names and exam codes are trademarks of their respective owners and are used for identification only.