Performance Monitoring and Tuning · Topic 2 of 16
Query Profile Steps, Operator Tree, Nodes and Operator Types
Know the Query Profile building blocks for ADA-C02: steps, the operator tree, operator nodes and the operator types to recognize and what each signals.
- 5 min
- Includes a diagram
- Steps appear only when a query runs in stages; the operator tree runs from scans at the bottom to
Resultat the top. - Each node shows type, ID and percentage of total time.
- Know the groups: data access, data processing, DML, metadata and miscellaneous.
What it is
A Query Profile is built from four ideas. A step is one stage of a query that ran as several. The operator tree is the whole plan drawn as a graph. An operator node is one box in it, and each node has an operator type that says what kind of work it does.
The exam likes to show a symptom, such as a join that returns billions of rows, and ask which operator is the cause. Knowing the operator names and what a bad one looks like is the skill.
How it works
Steps
Some queries run as one step. Others run as several, for example when a statement must first create an intermediate result. The navigation controls let you move between steps, and they appear only when the query ran in steps. If a profile shows no step controls, the whole query is one plan.
Operator tree
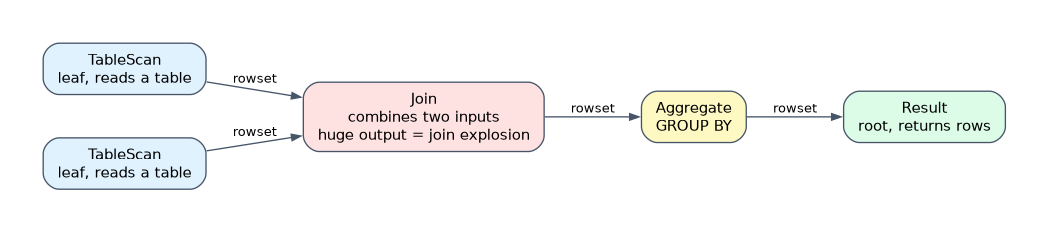 Data flows from the bottom of the tree to the top. The leaves are data access operators such as
TableScan, and the root is the Result operator that returns rows to the client. The arrows between nodes carry the rowsets produced by one operator for the next.
Arrows are the place to spot trouble. If a node receives a few thousand rows and sends out millions, something in it multiplies rows.
Operator nodes
Each node shows its operator type and ID, its share of the total query time as a percentage, and a short preview of its details such as a table name or an expression list. Click a node to see its Attributes, while the Statistics pane for the whole query stays visible beside it.
- A high percentage marks a candidate for tuning, but check why the node is slow.
- The node ID lets you tie a node to the text of an
EXPLAINplan.
Operator types
| Group | Operators | What they do |
|---|---|---|
| Data access and generation | TableScan, IndexScan, ValuesClause, Generator, ExternalScan, InternalObject | Read a table, a hybrid table index, literal values, generated rows, staged files, or internal objects such as Information Schema tables |
| Data processing | Filter, Join, Aggregate, GroupingSets, WindowFunction, Sort, SortWithLimit, Flatten, JoinFilter, UnionAll, ExternalFunction | Transform rows |
| DML | Insert, Delete, Update, Merge, Unload | Change data or export it |
| Metadata | DDL and transaction commands, table creation command, query result reuse, metadata based result | Work answered without scanning data |
| Miscellaneous | Result | Return the final output |
What the commonly tested ones signal:
TableScanshows the table, columns read and partitions scanned against total. A high share of time here points at too much data read or poor pruning.Joincombines two inputs on a condition. A very high output row count means a join explosion, usually a missing or wrong join condition.AggregatedoesGROUP BYandSELECT DISTINCT. High memory use here can cause spilling.Sortorders everything;SortWithLimitreturns only a limited slice, which is cheaper.JoinFilterdrops rows early that cannot match a later join. Seeing it means the optimizer found a way to cut data before the join.Flattenprocesses semi structured data and can multiply rows.ExternalScanreads files from a stage, as in aCOPYload.- Query result reuse means the result cache answered the query. Metadata based result means the answer came from metadata, such as
SELECT COUNT(*) FROM t, without a warehouse.
When a profile shows a single node labelled metadata based result, no warehouse was needed and no compute credits were spent.
Common mistakes
Thinking every query has steps. Step navigation exists only when the query ran in several steps.
Confusing Sort with SortWithLimit. The second is used when a limit is combined with ordering, and it avoids sorting the full set.
Blaming Join for time that belongs to its inputs. If the scan beneath it is slow, fix the scan.
Ignoring row counts on arrows. A jump in rows between two nodes is the clue to a join explosion or a Flatten that multiplies rows.
What to remember for the exam
- Steps appear only when a query runs in stages; the operator tree runs from scans at the bottom to
Resultat the top. - Each node shows type, ID and percentage of total time.
- Know the groups: data access, data processing, DML, metadata and miscellaneous.
- A join with far more output rows than input is a join explosion, often from a missing join condition.
- Query result reuse and metadata based result nodes mean no real scan happened.
Check yourself
What does an operator node display?
Its operator type and ID, its percentage of total query time and a preview of its details.
A
Joinnode outputs billions of rows from small inputs. What is likely wrong?A join explosion from a missing or too loose join condition, such as an accidental Cartesian product.
Which operator signals that the optimizer dropped non matching rows before a later join?
JoinFilter.
Topic 2 of 16 in Performance Monitoring and Tuning
Test yourself on Performance Monitoring and Tuning
The full Snowflake ADA-C02 question bank has 814 questions, with timed practice exams and an explanation for every answer.
This study guide is independent and is not affiliated with, endorsed by, or sponsored by Snowflake. Vendor names, certification names and exam codes are trademarks of their respective owners and are used for identification only.