Model the data · Topic 1 of 6
Table and Column Properties and Relationships
PL-300 data model design: set table and column properties, define relationship cardinality and cross filter direction, and implement role playing dimensions.
- 5 min
- Includes a diagram
- Dimension to fact is one to many, with a single filter direction, by default.
- The one side must have unique values. A key mismatch in type prevents a relationship.
- Only one relationship between two tables can be active. USERELATIONSHIP activates an inactive one in a measure.
What it is
In Model view, you connect tables with relationships and set properties on tables and columns. Relationships decide how a filter on one table reaches another. Properties decide how fields look, sort, summarise and appear to report authors. Together they make the difference between a model that gives correct totals and one that does not.
How it works
Relationships and cardinality
A relationship joins one column in each table. Cardinality says how many rows match.
| Cardinality | Meaning | Typical use |
|---|---|---|
| One to many | A value appears once on the one side and many times on the many side | Dimension to fact. The most common and the best |
| Many to one | The same, drawn the other way round | Same as above |
| One to one | Each value appears once on both sides | Splitting one entity into two tables |
| Many to many | Values repeat on both sides | Use only when no dimension exists. Prefer a bridge table |
The one side needs unique values. The many side holds the foreign key. If you load a table with duplicate keys on the intended one side, Power BI cannot create a one to many relationship.
Cross filter direction
| Direction | Effect |
|---|---|
| Single | A filter on the one side filters the many side. This is the default and the safest |
| Both | Filters flow in both directions |
Set Both only when you need it, for example a slicer on the fact side that must filter a dimension. Bi directional filters can create ambiguity and slow queries. A one to one relationship always filters both ways.
Active and inactive relationships
Only one active relationship can exist between two tables. Additional relationships are inactive and appear as dashed lines. A measure can use an inactive relationship by calling USERELATIONSHIP.
Sales by Ship Date =
CALCULATE ( [Sales Amount], USERELATIONSHIP ( Sales[ShipDate], 'Date'[Date] ) )
Role playing dimensions
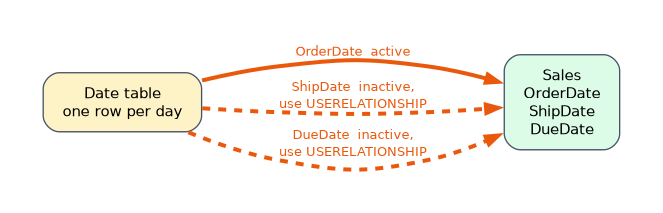 A role playing dimension is one dimension table used in several roles. The classic case is the Date table. A Sales table has OrderDate, ShipDate and DueDate, and each should relate to the same Date table.
There are two approaches.
| Approach | How | Best when |
|---|---|---|
| One table, several relationships | One Date table, one active relationship (OrderDate) and inactive ones for ShipDate and DueDate, activated by USERELATIONSHIP | You mainly analyse one date and sometimes the others |
| One table per role | Separate Date tables, for example Order Date and Ship Date, each with its own active relationship | You need slicers for several dates at once |
The second approach duplicates the table, so use Power Query reference or a calculated table.
Table and column properties
Select a field in Model view to edit its Properties.
| Property | Use |
|---|---|
| Name and Description | Clear names help report authors and Copilot |
| Is hidden | Hide keys and helper columns from the report view |
| Data category | Marks Address, City, Country, Latitude, Web URL, Image URL and so on, so maps and links work |
| Format | Number or date format, applied everywhere the field is used |
| Summarize by | Sum, Average, Count, None. Set IDs to None |
| Sort by column | Sorts a column by another, such as Month name by Month number |
| Display folder | Groups fields in the field list |
| Synonyms | Alternative names for Q&A and Copilot |
On a table you can also choose Mark as date table, covered on the next page. For DirectQuery models, Assume referential integrity tells Power BI to use an inner join, which is faster, but only when every foreign key has a matching row.
A worked scenario
A Sales table has OrderDate and ShipDate. The analyst relates OrderDate to Date as the active relationship and ShipDate as inactive. Revenue by month uses the active relationship. A measure called Shipped Revenue uses USERELATIONSHIP to return revenue by ship month. Month names sort wrongly alphabetically, so she sets Sort by column to Month Number, and sets Product ID to Don't summarize and hides it.
What to remember for the exam
- Dimension to fact is one to many, with a single filter direction, by default.
- The one side must have unique values. A key mismatch in type prevents a relationship.
- Only one relationship between two tables can be active. USERELATIONSHIP activates an inactive one in a measure.
- Role playing: one Date table with several relationships, or a copy of the table per role.
- Sort by column fixes month and weekday order. Summarize by None stops IDs being added up.
Bi directional filtering and many to many relationships can give surprising totals and hurt performance. Use them deliberately.
How the exam asks about this
- "Analyse sales by order date and by ship date." Role playing dimension with USERELATIONSHIP.
- "Month names sort alphabetically." Sort by column.
- "A report adds up a customer ID." Set Summarize by to Don't summarize.
- "Filters must flow from the fact side to a dimension." Cross filter direction Both, if justified.
Common mistakes
Two active relationships. Power BI makes the second inactive.
Using many to many to avoid cleaning keys.
Leaving numeric keys summarised.
Using Both direction everywhere.
Check yourself
Which DAX function uses an inactive relationship?
USERELATIONSHIP, inside CALCULATE.
What cardinality joins a dimension to a fact table?
One to many.
What property fixes the order of month names?
Sort by column.
Topic 1 of 6 in Model the data
Test yourself on Model the data
The full Microsoft PL-300 question bank has 657 questions, with timed practice exams and an explanation for every answer.
This study guide is independent and is not affiliated with, endorsed by, or sponsored by Microsoft. Vendor names, certification names and exam codes are trademarks of their respective owners and are used for identification only.