Describe an Analytics Workload on Azure · Topic 3 of 4
Batch and Real Time Analytics
DP-900 real time analytics: batch against streaming data, Event Hubs, IoT Hub, Stream Analytics windows, Spark streaming and Fabric Real Time Intelligence.
- 6 min
- Includes a diagram
- Batch handles groups at intervals. Streaming handles events as they arrive.
- Event Hubs ingests streams. IoT Hub manages devices.
- Stream Analytics runs a SQL like query over a stream, using windows.
What it is
Data can be processed in two rhythms. Batch processing collects data and handles it in large groups at set times. Streaming processing handles each event as it arrives, so results are available within seconds.
The choice depends on how quickly the answer is needed and how much latency the business can accept.
How it works
Batch compared with streaming
| Batch | Streaming | |
|---|---|---|
| Data handled | A large group collected over time | Each event or small group as it arrives |
| Latency | Minutes to hours or more | Seconds or less |
| Typical use | Nightly sales reports, payroll | Fraud detection, sensor alerts, live dashboards |
| Cost and complexity | Simpler, cheaper per record | More moving parts |
Latency is the delay between an event happening and its result being available. Streaming reduces latency, but it is not needed for every question.
Ingesting streams
Streaming data needs a service that can accept many events per second and hold them until processing.
- Azure Event Hubs is a big data streaming platform and event ingestion service that can receive millions of events per second. Applications that send events are producers, and those that read them are consumers. It also exposes an endpoint that Apache Kafka applications can use.
- Azure IoT Hub connects and manages internet of things devices. It supports two way messaging, so you can also send commands back to devices.
- Apache Kafka is an open source streaming platform, available in Azure through HDInsight or the Event Hubs Kafka endpoint.
Processing streams
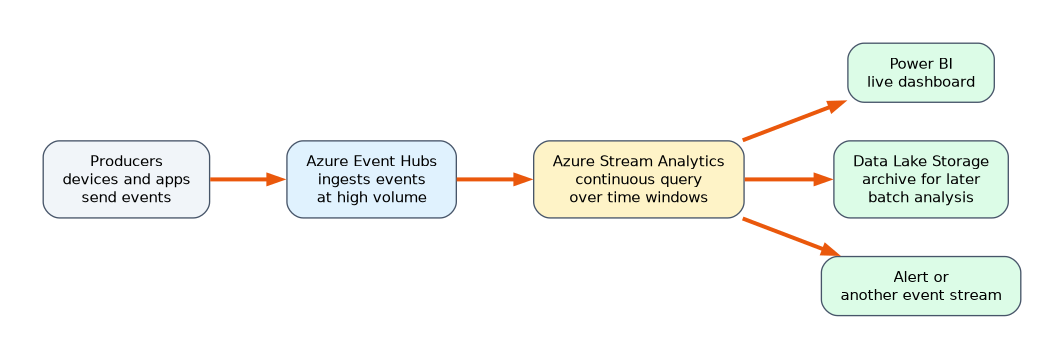 Azure Stream Analytics is a managed service that runs a SQL like query continuously over incoming events. Because streams never end, queries usually work on a window, a slice of time.
| Window | Behaviour |
|---|---|
| Tumbling | Fixed size, no overlap, every event in exactly one window |
| Hopping | Fixed size, and a smaller hop so windows overlap |
| Sliding | Produces output only when an event enters or leaves the window |
| Session | Groups events that arrive close together, closing after a gap |
| Snapshot | Groups events that share the same timestamp |
SELECT System.Timestamp() AS WindowEnd, AVG(Temperature) AS AvgTemp
FROM SensorInput TIMESTAMP BY EventTime
GROUP BY TumblingWindow(minute, 5)
This query reports the average temperature of each five minute period.
Spark Structured Streaming processes streams with Apache Spark, using the same code you write for batch data. It runs in Azure Databricks, Azure Synapse Analytics and Microsoft Fabric.
Real Time Intelligence in Fabric
Real Time Intelligence in Microsoft Fabric is the streaming workload. It lets you bring in events, query them in near real time, and trigger actions, in the same platform as the rest of Fabric. Data can arrive from sources such as Event Hubs and be queried with Kusto Query Language. Azure Data Explorer is the related Azure service for fast analysis of log and telemetry data.
Choosing a service
| The need | Service |
|---|---|
| Take in millions of events a second | Azure Event Hubs |
| Manage and talk to IoT devices | Azure IoT Hub |
| Run a continuous SQL like query on a stream | Azure Stream Analytics |
| Process streams with Spark code | Spark Structured Streaming |
| Real time analytics within Fabric | Real Time Intelligence |
A worked scenario
A factory has 5,000 machines that send temperature readings every second. IoT Hub receives the messages and routes them on for processing. A Stream Analytics job averages each machine's temperature over a tumbling window of one minute and raises an alert when the average passes a limit. The same readings are also written to a data lake. Each night, a batch job reads the lake to build a monthly maintenance report. One system therefore mixes streaming for alerts with batch for reports.
How fast does the answer need to be?
| Requirement | Approach |
|---|---|
| Daily report ready by morning | Batch |
| Fraud check before a payment completes | Streaming |
| Hourly summary of website visits | Batch, or micro batch |
| Temperature alert within seconds | Streaming |
| Live dashboard of orders | Streaming |
Where Stream Analytics sends results
A Stream Analytics job reads from inputs such as Event Hubs, IoT Hub or Blob Storage, and writes to outputs. Outputs can be Power BI for a live dashboard, Blob Storage or Data Lake Storage for later batch analysis, Azure SQL Database, Azure Cosmos DB, or another Event Hubs stream that triggers further action. Writing the same stream to two outputs is common, one for the dashboard and one for archive.
A hopping window example
A query might report the average temperature over ten minutes, recalculated every two minutes. That is a hopping window with a size of ten minutes and a hop of two. Consecutive windows overlap, so each event is counted in several results, which gives a smooth, steadily updated figure.
Reliability of streams
Streaming systems must cope with late and out of order events. They use event time stamps and a small waiting period to place events in the right window. Event Hubs keeps events for a retention period, so a consumer that falls behind or restarts can read them again from where it stopped.
What to remember for the exam
- Batch handles groups at intervals. Streaming handles events as they arrive.
- Event Hubs ingests streams. IoT Hub manages devices.
- Stream Analytics runs a SQL like query over a stream, using windows.
- Tumbling windows do not overlap. Hopping windows overlap.
- Real Time Intelligence is Fabric's streaming workload.
"Alert within seconds" or "live dashboard" points to streaming. "Nightly" or "monthly report" points to batch.
How the exam asks about this
- "Which service ingests large volumes of events?" Azure Event Hubs.
- "Which window never overlaps?" Tumbling.
- "Which service sends commands back to devices?" Azure IoT Hub.
- "What is the delay between an event and its result?" Latency.
Common mistakes
Choosing streaming for everything. It costs more and is only needed when the answer is urgent.
Mixing up Event Hubs and Stream Analytics. Event Hubs collects events. Stream Analytics processes them.
Confusing tumbling and hopping windows. Only hopping windows overlap.
Treating IoT Hub as a general event store. It is for device connections and messages.
Check yourself
What is latency?
The delay between an event occurring and its result being available.
Which Azure service ingests events from producers at very high volume?
Azure Event Hubs.
Which window type has fixed size and no overlap?
A tumbling window.
Topic 3 of 4 in Describe an Analytics Workload on Azure
Test yourself on Describe an Analytics Workload on Azure
The full Microsoft DP-900 question bank has 503 questions, with timed practice exams and an explanation for every answer.
This study guide is independent and is not affiliated with, endorsed by, or sponsored by Microsoft. Vendor names, certification names and exam codes are trademarks of their respective owners and are used for identification only.