Ensuring solution and operations excellence · Topic 1 of 3
Operational Excellence and Observability
The operational excellence pillar and Google Cloud Observability: Monitoring, Logging, Trace, Profiler, Error Reporting and SLO burn-rate alerts.
- 4 min
- Includes a diagram
- Operational excellence: readiness, incident management, automation, continuous improvement.
- Monitoring with metrics scopes and Managed Service for Prometheus.
- Logging: buckets, sinks, exclusions, Log Analytics;
_Required400 days,_Default30 days.
What it is
The operational excellence pillar of the Google Cloud Well-Architected Framework is about running workloads efficiently: being ready for operations, managing incidents and problems, automating change and improving continuously. Google Cloud Observability is the toolset that makes it possible: Cloud Monitoring, Cloud Logging, Cloud Trace, Cloud Profiler and Error Reporting.
How it works
Operational excellence principles
| Principle | In practice |
|---|---|
| Operational readiness | Define SLOs, runbooks and on-call before launch |
| Incident and problem management | Clear roles, paging, blameless postmortems with tracked actions |
| Manage and optimize resources | Rightsize, autoscale, remove waste |
| Automate and manage change | Infrastructure as code, CI/CD, policy as code |
| Continuously improve | Learn from incidents and metrics, review regularly |
Monitoring
- Cloud Monitoring collects metrics from Google Cloud services, agents (Ops Agent on VMs) and custom metrics.
- Managed Service for Prometheus stores Prometheus metrics with PromQL queries, removing self-run Prometheus servers; managed collection is the low-effort option.
- Metrics scopes let one scoping project show dashboards and alerts for many projects while they stay separate for access and billing.
- Uptime checks probe endpoints from several locations.
Logging
| Feature | Use |
|---|---|
| Log buckets with retention | _Default keeps logs 30 days unless changed; _Required keeps audit and system logs 400 days |
| Sinks | Route logs to buckets, BigQuery, Cloud Storage or Pub/Sub, at project, folder or organization level |
| Exclusion filters | Drop noisy logs from ingestion to cut cost |
| Log Analytics | SQL over logs in log buckets |
| Log-based metrics | Turn log patterns into metrics for alerts |
To keep verbose debug logs cheaply for later offline analysis, route them with a sink to Cloud Storage and exclude them from the _Default sink.
Tracing, profiling and errors
| Tool | Answers |
|---|---|
| Cloud Trace (with OpenTelemetry) | Where time goes across services and downstream calls |
| Cloud Profiler | Which functions use CPU and memory, continuously in production with low overhead |
| Error Reporting | Groups identical exceptions from logs and notifies on new error groups |
Benchmarking
Benchmark before and after changes with repeatable load tests and the same metrics, so a performance claim is backed by numbers. Compare against SLOs, not just against the previous build.
Alerting strategies
| Approach | Verdict |
|---|---|
| Alerts on raw thresholds (CPU, a fixed error count) | Noisy; misses low-traffic failures and fires during busy launches |
| Alerts by email only | Ignored; route to paging and chat channels |
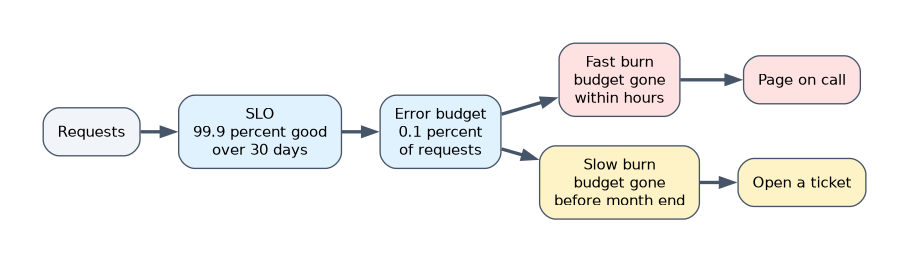
| SLO burn-rate alerts | Page when the error budget is being consumed fast; warn on slow burns |
| Alerts with documentation and runbook links | Faster response |
An SLO sets a target such as 99.9 percent of requests succeeding over 30 days. The error budget is the allowed 0.1 percent. A fast burn alert pages when the budget is being spent so quickly that it would run out within hours or days; a slow burn alert opens a ticket. Request-based SLOs follow traffic, so a launch-day surge with a normal error ratio stays quiet, and a bug failing one request in five at 3 a.m. pages.
How the exam asks about this
- "One place for dashboards and alerts across 40 projects that stay separate." A scoping project with a metrics scope.
- "Keep PromQL rules and Grafana dashboards, stop running Prometheus servers." Managed Service for Prometheus with managed collection.
- "New kinds of exceptions noticed only through support tickets, no code change." Error Reporting with notifications.
What to remember for the exam
- Operational excellence: readiness, incident management, automation, continuous improvement.
- Monitoring with metrics scopes and Managed Service for Prometheus.
- Logging: buckets, sinks, exclusions, Log Analytics;
_Required400 days,_Default30 days. - Trace for latency, Profiler for CPU, Error Reporting for exceptions.
- Alert on SLO burn rates through paging channels, not raw thresholds by email.
Reducing the _Default bucket retention to save money also removes searchable history that engineers may need.
Common mistakes
Fixed thresholds that page during every launch and miss quiet failures.
Profiling with Cloud Trace. Traces show elapsed time, not CPU per function.
Separate dashboards per project instead of one metrics scope.
Check yourself
What is an error budget?
The amount of unreliability an SLO allows, for example 0.1 percent of requests for a 99.9 percent target.
Which tool groups identical exceptions and notifies on new ones?
Error Reporting.
How long does the
_Requiredlog bucket keep logs?400 days.
Topic 1 of 3 in Ensuring solution and operations excellence
Test yourself on Ensuring solution and operations excellence
The full Google Cloud Professional Cloud Architect question bank has 877 questions, with timed practice exams and an explanation for every answer.
This study guide is independent and is not affiliated with, endorsed by, or sponsored by Google Cloud. Vendor names, certification names and exam codes are trademarks of their respective owners and are used for identification only.