Monitoring and Logging · Topic 5 of 5
Alarms and Monitoring Automation
Configure CloudWatch and composite alarms, route events with EventBridge and SNS, and roll out monitoring across accounts with cross account observability.
- 7 min
- Includes a diagram
- Alarm states are OK, ALARM and INSUFFICIENT_DATA.
- "M out of N" evaluation uses datapoints to alarm with evaluation periods.
- Choose
notBreachingfor missing data on sparse metrics.
What it is
An alarm watches a metric and acts when it crosses a threshold. In a large environment nobody can create alarms by hand for every instance, account and Region, so the monitoring itself must be automated and deployed as code.
This page covers how alarms are built, how alarms and events trigger actions, and how to roll out and centralize monitoring in a multi account setup.
How it works
Alarm states and evaluation
An alarm is in one of three states: OK, ALARM or INSUFFICIENT_DATA. Three settings shape the evaluation.
| Setting | Meaning |
|---|---|
| Period | Length of each data point window, such as 60 seconds |
| Evaluation periods | How many recent periods are examined |
| Datapoints to alarm | How many of those must breach, for an "M out of N" rule |
The treat missing data setting decides what a gap means: treat it as missing (keep state), notBreaching, breaching or ignore. For a metric that only exists when events happen, notBreaching avoids false alarms.
aws cloudwatch put-metric-alarm --alarm-name api-5xx-high \
  --namespace AWS/ApplicationELB --metric-name HTTPCode_Target_5XX_Count \
  --dimensions Name=LoadBalancer,Value=app/my-alb/50dc6c495c0c9188 \
  --statistic Sum --period 60 --evaluation-periods 5 --datapoints-to-alarm 3 \
  --threshold 10 --comparison-operator GreaterThanThreshold \
  --treat-missing-data notBreaching \
  --alarm-actions arn:aws:sns:us-east-1:111122223333:ops-alerts
Alarm actions
| Action | Use |
|---|---|
| Amazon SNS notification | Email, SMS, chat or a trigger for other automation |
| Auto Scaling policy | Scale out or in |
| EC2 action | Stop, terminate, reboot or recover an instance |
| Systems Manager action | Create an OpsItem or an incident |
Every alarm state change also produces an EventBridge event, so a rule can run a Lambda function or an Automation runbook.
Composite alarms
A composite alarm combines other alarms with AND, OR and NOT. It reduces noise: instead of paging for CPU, latency and error alarms separately, page once when the right combination is true.
aws cloudwatch put-composite-alarm --alarm-name app-unhealthy \
  --alarm-rule "ALARM(api-5xx-high) AND ALARM(latency-high)" \
  --alarm-actions arn:aws:sns:us-east-1:111122223333:pager
A metric math alarm uses an expression, such as the ratio of errors to requests, as the watched value.
Event management
Amazon EventBridge matches events from AWS services and routes them to targets. Use it for state changes that are not metrics, such as an EC2 instance entering terminated, a Config compliance change or an AWS Health event. Amazon SNS handles notification and fan out, with filter policies so each subscriber gets only relevant messages.
Processing log files from S3
When log files land in an S3 bucket, an S3 event notification can start a Lambda function that parses the new object and delivers the records to another destination, such as Amazon OpenSearch Service or CloudWatch Logs.
- Notification: send
s3:ObjectCreated:*events to the function, with a prefix or suffix filter so only log objects match. Never write the output under the same filtered prefix, or the function triggers itself. - Permission: the function needs a resource policy that lets S3 invoke it, scoped to the bucket and account. Its execution role needs read access to the objects and write access to the destination.
- Delivery: for CloudWatch Logs the function calls
put-log-eventson a log stream. For OpenSearch it sends documents with the bulk API, and the domain access policy must allow the function role. - Failures: S3 invokes the function asynchronously, so configure an on-failure destination or a dead letter queue (DLQ) on the function. Delivery is at least once, so make the processing safe to repeat.
aws lambda add-permission --function-name log-parser --statement-id s3-invoke \
  --action lambda:InvokeFunction --principal s3.amazonaws.com \
  --source-arn arn:aws:s3:::my-log-bucket --source-account 111122223333
Automating the rollout
Set up monitoring through code and through managed configuration so new resources are covered without a manual step.
- CloudFormation or CDK: put alarms in the same template as the resource they watch. A StackSet can deploy a baseline of account level alarms and dashboards to every account.
- Systems Manager State Manager: an association keeps the CloudWatch agent installed and configured on tagged instances, and a Quick Setup configuration can apply it across an organization.
- Auto Scaling: target tracking policies create and manage their own alarms.
- Tag based discovery: automation selects resources by tag, so adding the tag opts a resource in.
- EventBridge: a rule on instance launch can trigger a function that creates default alarms for the new resource.
- AWS Config: a rule can flag resources lacking alarms or logging, with remediation to add them.
Cross account observability
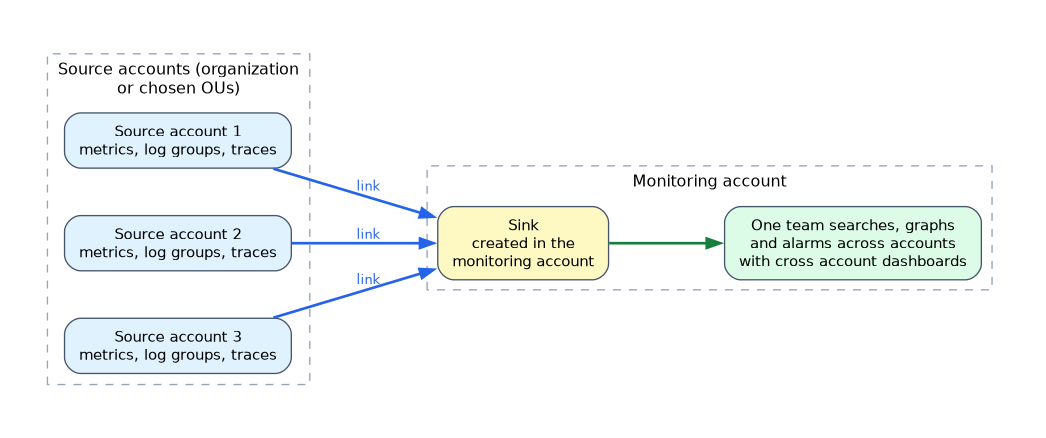 CloudWatch cross account observability links source accounts to a monitoring account. The monitoring account creates a sink, and each source account creates a link to it. Metrics, log groups, traces and more then appear in the monitoring account, so one team can search, graph and alarm across the organization.
Links can be set up for a whole organization or for chosen OUs.
Dashboards can also show widgets from multiple accounts and Regions in a single view.
Health and operational events
AWS Health reports events that affect your resources, such as scheduled maintenance or service issues. An organizational view collects them for all accounts, and EventBridge rules turn them into tickets or runbook executions. Amazon Managed Grafana gives a single pane that reads CloudWatch, Prometheus and other sources for teams that prefer it.
Operational response
Alarms can open an OpsItem in Systems Manager OpsCenter or start an incident in Systems Manager Incident Manager, which adds contacts, escalation plans and runbooks. Closing the loop in code keeps response consistent.
What to remember for the exam
- Alarm states are OK, ALARM and INSUFFICIENT_DATA.
- "M out of N" evaluation uses datapoints to alarm with evaluation periods.
- Choose
notBreachingfor missing data on sparse metrics. - Composite alarms reduce noise by combining alarm states.
- Alarms can act on SNS, Auto Scaling, EC2 and Systems Manager; state changes also reach EventBridge.
- Deploy alarms with CloudFormation, CDK or StackSets and keep the agent in place with State Manager.
- Cross account observability uses a monitoring account sink and links from source accounts.
- Use EventBridge for non metric events such as Config changes and AWS Health events.
- SNS filter policies deliver only matching messages to a subscriber.
When a question asks to reduce alert fatigue while still catching real incidents, think composite alarms before adding more thresholds.
Common mistakes
Alarming on one data point. A single spike pages someone, so use M out of N.
Leaving missing data as the default. Sparse metrics then sit in INSUFFICIENT_DATA and hide problems.
Hand built alarms per account. They drift, and new accounts never get them.
Building dashboards per account. Operators have to switch accounts during an incident.
An alarm action to an SNS topic only works if the topic policy allows CloudWatch to publish to it, and an encrypted topic also needs a key policy that allows it.
Check yourself
Which alarm type pages once when two separate conditions are both true?
A composite alarm using AND over the two alarms.
How do you view logs and metrics from many accounts in one place?
Set up CloudWatch cross account observability with a monitoring account sink and links from source accounts.
How do you keep the CloudWatch agent installed on new instances?
Use a State Manager association that targets instances by tag.
Topic 5 of 5 in Monitoring and Logging
Test yourself on Monitoring and Logging
The full AWS DOP-C02 question bank has 844 questions, with timed practice exams and an explanation for every answer.
This study guide is independent and is not affiliated with, endorsed by, or sponsored by AWS. Vendor names, certification names and exam codes are trademarks of their respective owners and are used for identification only.